
Introduction
HDAnalytics is a light-weight, privacy focused, WordPress analytics and tracking plugin. Analytics are displayed in a gorgeous full-width dashboard widget.
How to Install and Activate
After you have purchased this plugin, an email will be sent to you with your activation license as well as a download link. Please remember to check your spam folder if you have not received this email.
- Log into your site and from the admin menu, select Plugins then the Add New button (found near the top of the page)
- Now select Upload Plugin and select the plugin you downloaded, then Install Now.
- Once the plugin has been installed, select the Activate Plugin button
Now that the plugin is on your site, you need to activate your license. You can do this by going to your dashboard where the widget will present you with a field to enter your license key.
HDAnalytics Settings
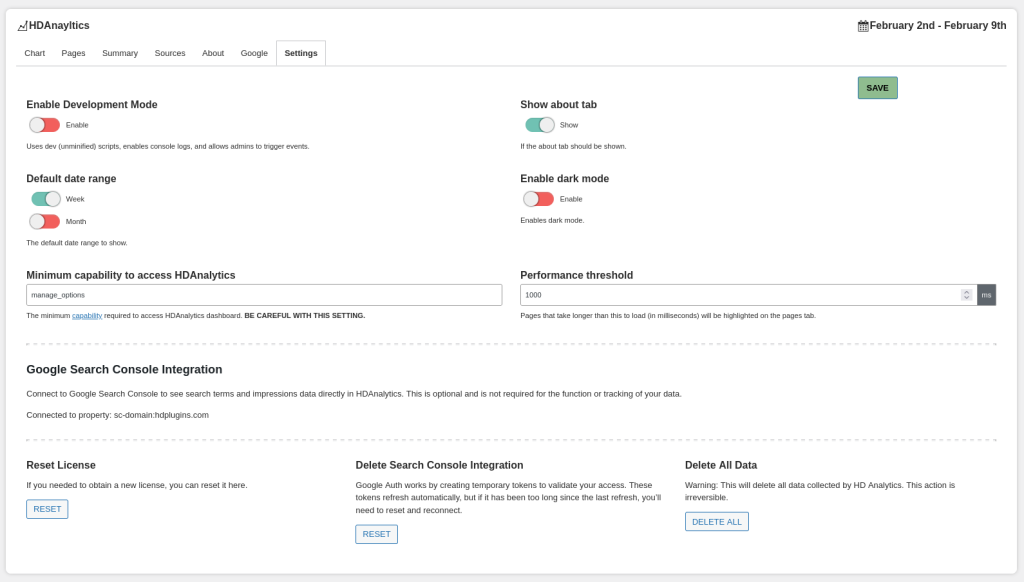
The settings tab will allow you to configure the basic settings of the addon.
Enable Development Mode
When enabled, this feature will display browser console logs whenever an event is posted by HDAnalytics. This can be useful for debugging purposes. It will also load the development scripts instead of the product scripts, which are more readable.
Show about tab
By default, an About tab is visible on the widget that provides a bit of an introduction to HDAnalytics as well as includes some useful information and terms for new users. You can disable this tab to hide it at any time if you no longer need it.
Default date range
By default, the widget will display the most recent 30 days of activity. You can use this feature to default to the most recent 7 days instead.
Enable dark mode
Toggles dark mode for the widget, which is just a different design for those who prefer the night.
Minimum capability to access HDAnalytics
By default, only admins (users with the manage_options capability) can view the dashboard widget. However, for those who want users with lower permissions to view the widget, you can set a custom capability. You can view the various options here: https://wordpress.org/documentation/article/roles-and-capabilities/#roles
Performance threshold
Set in milliseconds, the maximum average time for a page to become interactive until that page is considered “slow”. Slow pages will be marked with a turtle icon.
NOTE: Only pages that have at least 5 views will have their performance calculated. This is to mitigate issues of first time caches and to provide a more accurate view of your page performances.
Google Search Console Integration
If you have a search console property, HDAnalytics can integrate with it to display your search traffic.
- To get started, you must first select the AUTHORIZE button. This will pop up a new window where you can log into your Google account.
- You will now see “harmonicdesign.ca wants access to your Google Account” – that’s me, Harmonic Design! Select Continue.
- You will now be redirected to a page that will show your authorization code. Copy this code and paste it into the text field, then submit
If everything went well, the page will reload and you will now see a list of all of your Google Search Console properties. Select the one tied to your site and save.
How to change date range
You can filter your analytics through a custom date range by clicking on the date range located on the top right of the widget. This will show two date selectors for the Start Date, and End Date. This can be as long or short as you want, but note that if your range is very long, your site might struggle to parse all of the data.
Pages Tab
The Pages tab will display a table of all pages with views in the selected date range. The table consists of: Page title, page type, ATOP (average time on page), and Views. The pages are ordered by views.
Summary Tab
The Summary tab is a great place to get an overview of your site’s performance. This tab includes: location data, language data, device data, and total users.
Location is determined by using a user’s timezone. This is a very fast way to figure out a user’s country, but it does have its downsides.
One downside is that we cannot be more specific than country for location, and another is that it is not usually as accurate as IP based location tracking. However, in my testing, this implementation has been very accurate.
Locations can be classified into three categories: Country and region.
View locations tracked
Very accurate locations:
The following countries can be determined with a high degree of confidence.
- Australia
- Brazil
- Canada
- China
- Denmark
- Finland
- France
- Germany
- Iceland
- India
- Italy
- Japan
- Mexico
- Norway
- Philippines
- Russia
- South Korea
- Spain
- Sweden
- Thailand
- Turkey
- United Kingdom
- USA
- Vietnam
Inaccurate Regions:
If unable to determine location to one of the above, we can fall back to one of the following regions.
- Africa
- Asia
- Central America
- Europe
- Middle East
- Oceania
- South America
If still unable to determine location, we resort to classifying as “other”. I will be continuing to work on this to get as many countries in the accurate category as possible.
Languages are actually stored as their specific variants, but are combined in the dashboard to a unified language. For example, en-CA in Canadian English – but instead of displaying the language as Canadian, I group it with the other English variants.
Devices will show the percentage (and individual count on hover) of mobile vs desktop usage. Mobile is determined by checking to see if the user has touch input enabled. This means that it’s possible for there to be some false positives on the mobile side.
Users are not tracked across days. Due to the privacy focus of HDAnalytics, IPs are never stored, instead using daily hashed versions which are deleted every day. This ensures that the IPs are never actually saved and can never be retrieved. This also means that users are not tracked across days. If a user visits your site 4 times today, that will count as a single user. But if they come back tomorrow, they will be counted as a brand-new user.
Sources Tab
The sources tab will tell you how users are getting to your site.
Referrals happen whenever someone visits your site by clicking on a link from another site.
UTM metrics are various metrics embedded in links that can tell you more information about what it is that a user clicked on to get to you. This can be used to track certain advertising campaigns, or to know which particular link a user clicked on. Mailchimp has a good article on how to use UTM links.
Advanced / Developer Settings
HDAnalytics has many filters and settings that can be used to modify the behaviour of the system.
hdanalytics_bad_ip_list is a filter that will allow you add IP address’ to a blocklist. Any IPs on this list will be unable to send any tracking events. It accepts 1 array $bad_ips
hdanalytics_should_track is a filter that needs to return either true or false, which determines if the event should be recorded or not. It accepts an array $data as a parameter. You can use this to, for example, block tracking for certain countries, languages, events, etc.
Send Custom Event
You can send a custom event either via JavaScript, or PHP. Custom events will appear in their own tab. Currently, custom events are site-wide counters only, and cannot contain additional metadata such as product_id, page_id, etc.
JavaScript: HDA.send("event_name");
PHP: hdanalytics_send_event($event_name);